Language: English / Japanese
This study displays the simulation of atmospheric radioactive dispersion due to the accident at Fukushima Daiichi Nuclear Power Plant on March 12th, 2011.
Compared to the results previously released, there are two improvements including 1) the expansion of calculation area of ground level air concentration [Bq/m3] to cover the grater Tokyo area, and 2) precipitation estimation using AMeDAS (Automated Meteorological Data Acquisition System) data.
These simulations are based on publicly available data and original assumptions. Audience should be aware that the accuracy of the calculation is limited.
We frequently update the calculation whenever additional information is obtained.
We regret that we will not be able to answer individual questions because our resources are limited.
| Items | Contents | Reference |
|---|---|---|
| Models | Meteorological model:RAMS, Particle transport model:HYPACT | ATMET |
| Period | March 12th, 2011 - April 7th, 2011 | |
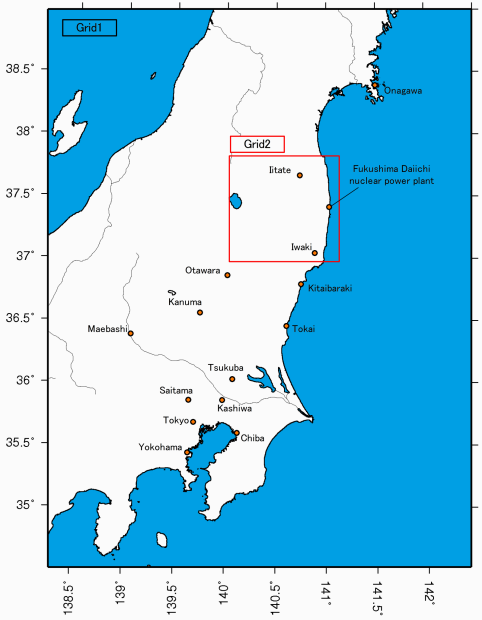
| Range | 600 km x 600 km with Fukushima Daiichi Nuclear Power Plant in its center (See Fig. 1) | |
| Horizontal lattice | Grid1:600×600[km]、10km mesh | |
| Vertical lattice | σ-z coordinate system, Grid with 20km altitude divided into 30 layers | |
| Radioactive material released | Iodine - 131 | |
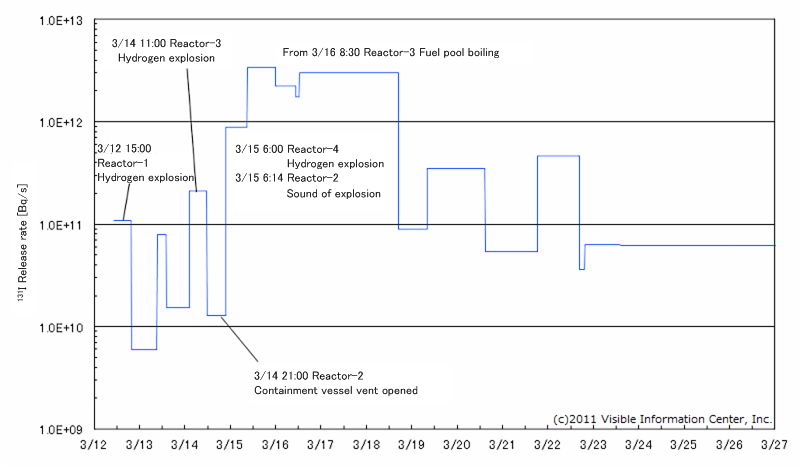
| Release rate[Bq/s] | Assumption based on released amount estimated by Nuclear Safety Commission*1 | |
| Release height | Normal:30m, Explosion:30m-200m | Based on press release |
| Decay process | Radioactive decay, dry deposition and wet deposition by precipitation | |
| Dry deposition velocity | 0.01m/s | |
| Washout parameter α | 1.2×10⁻⁴ | |
| Washout parameter β | 0.8 | |
| Number of released particles | ca. 20 million particles | |
| Meteorological data | MSM (Meso Scale Model) isobaric surface data and AMeDAS precipitation*2 | Japan Meteorological Agency |
| Topography data | 50m mesh numerical map | Geospatial Information Authority of Japan |
*1 At this point of time, accurate release amount is still unknown. We estimated the release ratio by multiplying coefficient and dose rate at main gate of the facility.(Fig.2)
*2 Precipitation map made from AMeDAS data was derived and applied because precipitation data produced by a meteorological model was not sufficient.
|
 |
The effort to improve accuracy of simulation by obtaining updated information is ongoing.
| Date | Ground level air concentration |
|---|---|
| 2011/03/12 10:00:00-24:00 | Wide range |
| 2011/03/13 0:00:00-24:00 | Wide range |
| 2011/03/14 0:00:00-24:00 | Wide range |
| 2011/03/15 0:00:00-24:00 | Wide range |
| 2011/03/16 0:00:00-24:00 | Wide range |
| 2011/03/17 0:00:00-24:00 | Wide range |
| 2011/03/18 0:00:00-24:00 | Wide range |
| 2011/03/19 0:00:00-24:00 | Wide range |
| 2011/03/20 0:00:00-24:00 | Wide range |
| 2011/03/21 0:00:00-24:00 | Wide range |
| 2011/03/22 0:00:00-24:00 | Wide range |
| 2011/03/23 0:00:00-24:00 | Wide range |
| 2011/03/24 0:00:00-24:00 | Wide range |
| 2011/03/25 0:00:00-24:00 | Wide range |
| 2011/03/26 0:00:00-24:00 | Wide range |
| 2011/03/27 0:00:00-24:00 | Wide range |
| 2011/03/28 0:00:00-24:00 | Wide range |
| 2011/03/29 0:00:00-24:00 | Wide range |
| 2011/03/30 0:00:00-24:00 | Wide range |
| 2011/03/31 0:00:00-24:00 | Wide range |
| 2011/04/01 0:00:00-24:00 | Wide range |
| 2011/04/02 0:00:00-24:00 | Wide range |
| 2011/04/03 0:00:00-24:00 | Wide range |
| 2011/04/04 0:00:00-24:00 | Wide range |
| 2011/04/05 0:00:00-24:00 | Wide range |
| 2011/04/06 0:00:00-24:00 | Wide range |
| 2011/04/07 0:00:00-09:00 | Wide range |
Radioactive material released from Fukushima Daiichi Nuclear Power Plant (100% of the released radioactive material was assumed to be Iodine-131 for this simulation) were transported by movements in the atmosphere “Wind”. This section explains how people surrounded by an atmosphere with radioactive material get affected.
Amount of specific radioactive material in the atmosphere is expressed by “concentration of radioactive material in the atmosphere”, in short “air concentration”. Suppose there is 1 Bq radiation in a 1 cubic meter air volume, air concentration is defined as 1(Bq/m3).
Air concentrations of radioactive materials decrease by following phenomena. Different materials shows different amount of decrease.
Above-mentioned phenomena decrease air concentrations of radioactive material. However, radioactive materials were added into the atmosphere by multiple releases from Fukushima Daiichi Nuclear Power Plant within the period considered in this study.
Figures presented here are the results of simulation (estimation of phenomena occurred in the past) based on trustworthy meteorological data including wind directions, wind-force and weather. Figures, especially animations, adequately depict time variation of air concentration and distribution.
Dry deposition and wet deposition mentioned above make radioactive material attach to the surfaces in the surroundings of people. Besides radioactive decay, wind and washout by rain decrease amount of radioactive materials. The amounts to stay, be blown away or be washed out differ by radioactive material.
Recently we often hear the word “exposure” in the news. People are exposed if he/she is in an atmosphere containing radioactive material. This section explains how people are exposed.
There are two features of exposure i.e., “external exposure” and “internal exposure”. “External exposure” means that people are exposed by radiation from radioactive material in the air or on the ground that are outside of body. On the other hand, paths of “internal exposure” are categorized with “inhalation” (through the air ways) and “ingestion” (through the digestive tract).
Suppose “submersion”, i.e. a person is surrounded by air with 1Bq/m3 131I, external exposure from air and internal exposure by inhalation are explained here.
To estimate dose by external exposure in submersion, dose conversion factor is used. Dose conversion factor has been defined for each radionuclide. Dose conversion factor of 131I, 1.82×10⁻¹⁴(Sv/s per Bq/m3)※1, expresses that a person surrounded by 1Bq/m3 air concentration of 131I is exposed to 1.82×10⁻¹⁴(Sv)of radiation per second. “Sv(Sievert)” is the unit of exposure for living body that exposed to radiation. Recently, we hear “micro Sievert per hour” in the news. This makes the dose conversion factor of 131I, 6.552×10⁻⁵(μSv/h).
To estimate internal exposure through inhalation, breathing rate must be considered. Dose coefficient of 131I inhalation has been defined as 7.4×10⁻⁹(Sv/Bq)※3. Suppose an adult person is surrounded by 1Bq/m3 air concentration of 131I and breathes one hour with average breathing rate of 2.22×10⁷(cm3/d)※2, it makes internal dose 6.85×10⁻³ (μSv/h)※4.
---------------
※1:"EXTERNAL EXPOSURE TO RADIONUCLIDES IN AIR, WATER, AND SOIL.", FEDERAL GUIDANCE REPORT NO.12,EPA-402-R-93-081 (1993)
※2:Radiation Exposure Dose Limit Target, Power Generating Light Water Reactors, NSC Regulatory Guides, September 28th(1976), March 29th (2001) revised
※3:ICRP Publication 72
※4:Internal dose(μSv/h)=1(Bq/m3)× 10-6(m3/cm3)×2.22×107(cm3/d) ×1/24(d/h) ×7.4×10⁻⁹(Sv/Bq)×106(μSv/Sv)
(C)2011 Visible Information Center, Inc.